Metrics
Working with metric tiles and creating favorite metrics
Leanplum tracks dozens of metrics, and they're all available in Analytics when viewing results for your messages, A/B tests, and overall app usage.
At any point, you can toggle between different metrics by using the Metric selector dropdown menu at the top of the chart, OR by clicking a metric tile below the chart.
Metric selector
The Metric selector dropdown is divided into the following categories: General Metrics, Custom Metrics, Automatic Event Metrics, Custom Event Metrics, and State Metrics. Note that you will only see the categories that contain metrics (i.e. if you don't have any custom events, you won't see the Custom Event Metrics section for your app).
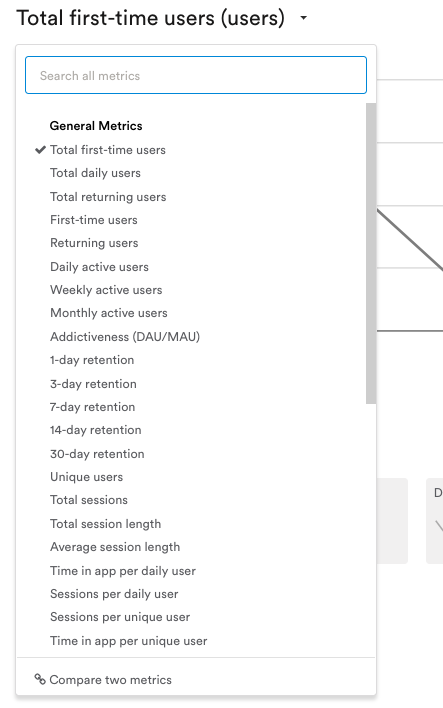
General Metrics lists all of Leanplum's out-of-the-box metrics, like "Time in app" and "Total purchases." These are calculated automatically after your initial SDK implementation (where you set up your purchase event). Note that the General Metrics category will show all of your general metrics, but other categories will only show the top 10 metrics in that section. You can always search for a metric to make it appear.
Custom Metrics lists all of the custom metrics you've created based on other metrics. You can create custom metrics using the process outlined here. Select your custom metric from the dropdown, or search to see it in the Analytics chart. For a refresher on creating custom metrics, see our Custom metrics guide.
Automatic Event Metrics contains all of the metrics that are based on events Leanplum creates automatically for you, such as message View events and A/B test impression events. Just select the event you are interested in to see its associated Metrics. For example, our "Ask again" message has an automatically created View event. Selecting this View event reveals all of its associated metrics.
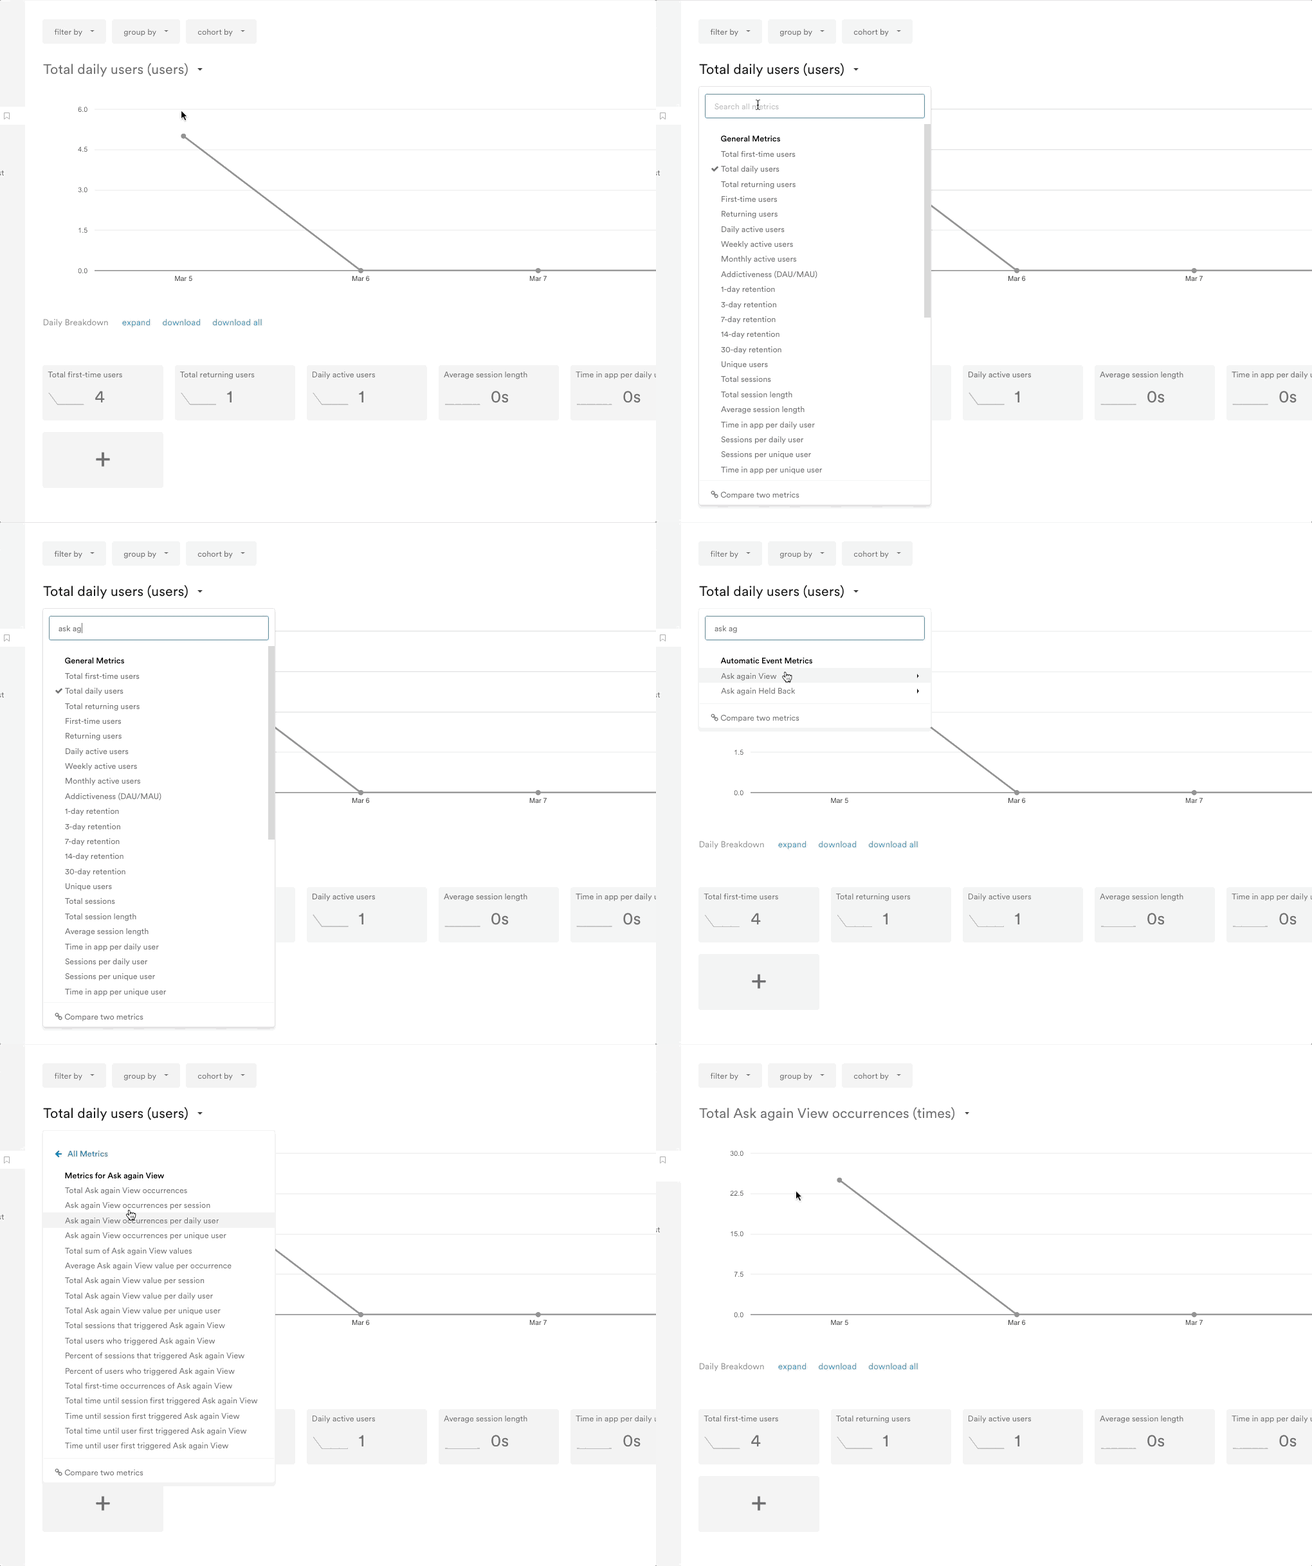
Event and state metrics will show your newest events by default, but you can use the search bar to bring up other events.
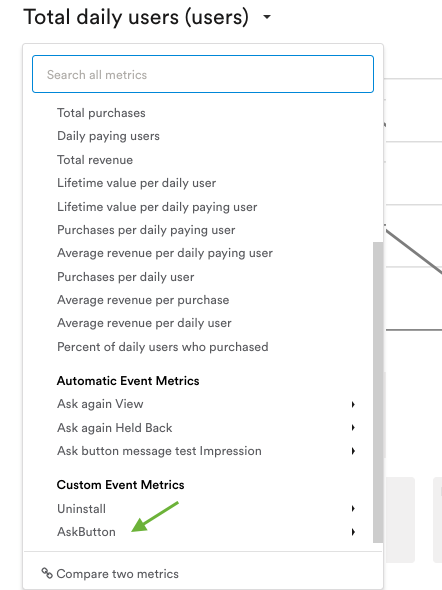
Custom Event Metrics contains all of the metrics that are calculated based on custom events you track in Leanplum. In the example below, AskButton is a custom event in our app. All of the metrics calculated based on this event are nested underneath that event in the dropdown. Simply click the event to see all of its associated metrics.
State Metrics contains all of the metrics associated with the states defined in your app. Just like with event metrics, select the state you want to see a metric for, then select your metric from the options that appear.
When using the Metric selector, the selected metric will not be saved to the report for later use. For that, you'll either need to bookmark the report or add the metric as a favorite.
Metric tiles
Metric tiles show some of your most important high-level metrics, along with any favorite metrics you have saved. By default, Leanplum will only show the most relevant metrics in the metric tiles below the main chart, along with any metrics you save as a favorite.
Add a new metric tile
Even if the default view does not show your intended metric as a tile, you can click the + button to add a new metric tile. This will open the "Choose a Metric" window, which will allow you to build the metric you'd like to add.
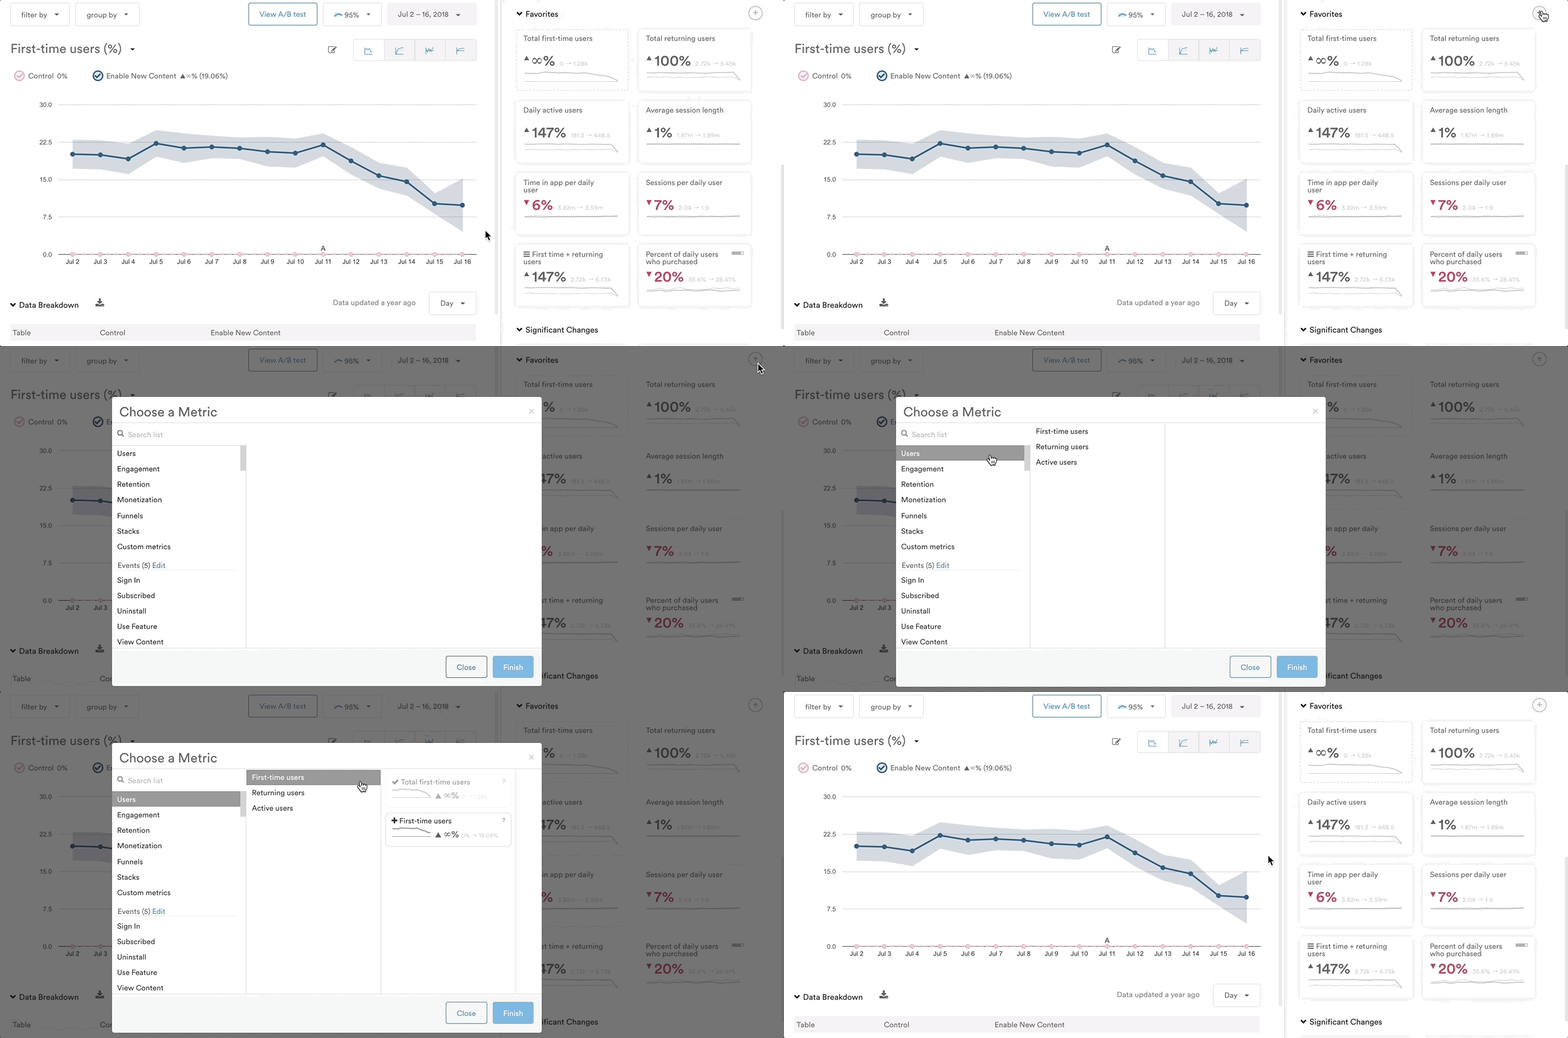
By default, Leanplum will only show the most relevant metrics in the metric tiles below the main chart, along with any metrics you save as a favorite.
You can use the Metric selector above the chart to find a metric, then save the metric to your favorites so it will always appear right below the chart (below your Goal metrics).
Manage your Favorites
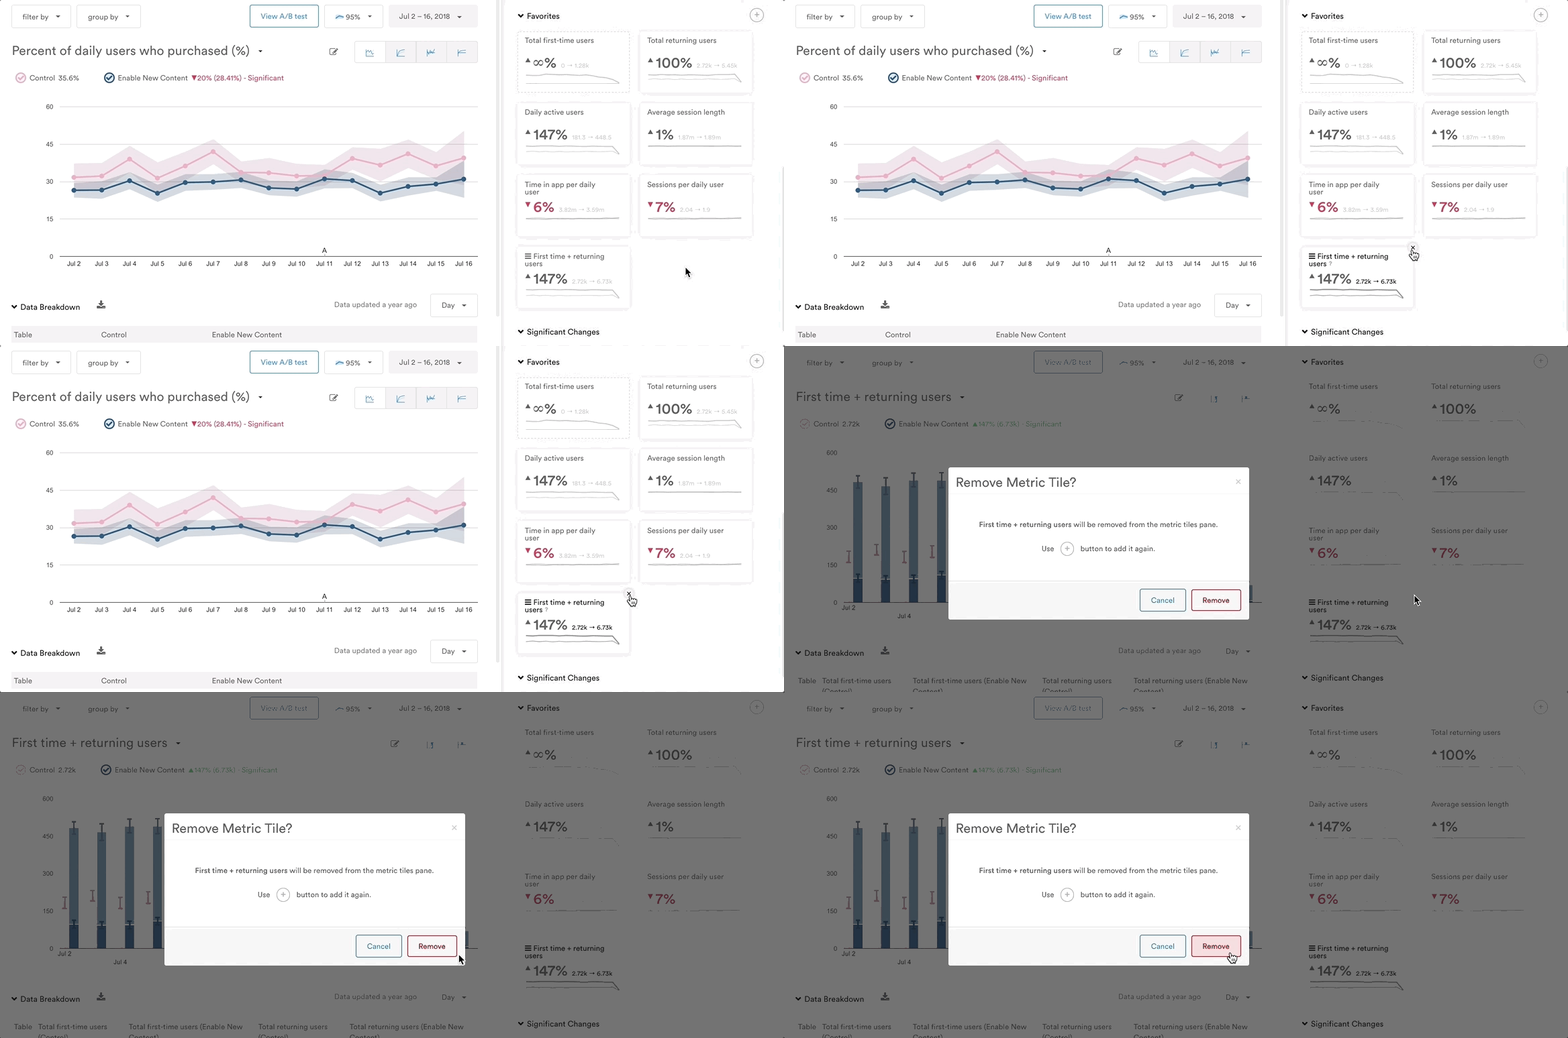
Favorite metrics will always appear just below the chart (below your Goal metrics). To add a metric to your favorites, click the "+" tile under the Favorites section and define the new metric.
You can click and drag your Favorite metric tiles to reorder them. Delete a tile by dragging it to the trash bar at the bottom of the browser window.
Updated about 3 years ago
