Email analytics
After sending an email campaign, you'll probably want to know how well it went. Here's a quick look at analyzing your Email messages and campaigns:
Email-specific metrics
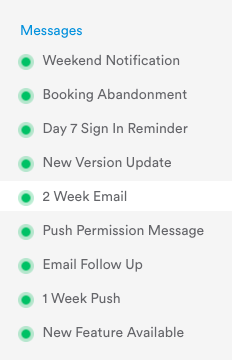
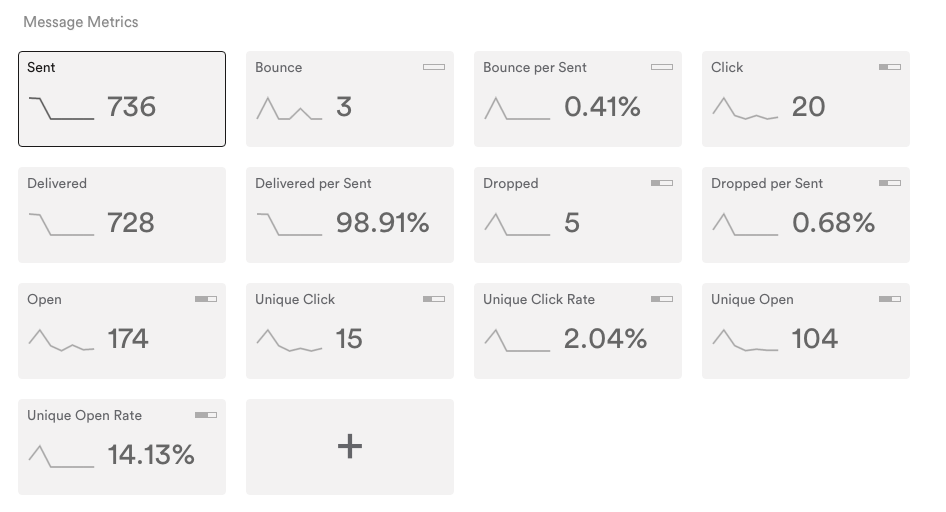
Leanplum automatically tracks several metrics for your email campaigns, including opens, clicks, bounces, and unsubscribes. All of your sent messages are visible in the left sidebar of the Analytics dashboard.

Our Analytics dashboard also lets you filter, group by, and slice the data as you please. See Analytics for more information.
Here's the full list:
| Metric | Definition |
|---|---|
| Delivered | Message was accepted by receiving server (not necessarily inbox). |
| Open | Recipient opened the HTML message (with images enabled) — tracked on each open. |
| Unique open | Multiple opens by the same user within the same day are only counted once. |
| Click | Recipient clicked on a link within the message. Does not include clicks on unsubscribe links (i.e. links which begin with https://www.leanplum.com/unsubscribe). |
| Unique click | Multiple clicks on the same link within the same day are only counted once. Does not include clicks on unsubscribe links. |
| Dropped | Message will not be delivered. Common reasons: email address is invalid, previous emails have bounced or been reported as spam. |
| Bounced | Attempted to send message but it bounced from the receiving server. Common reasons: email address is invalid, or the recipient inbox is full. |
| Reported as spam | Recipient marked message as spam. |
| Unsubscribe | Recipient clicked on messages’ subscription management link and unsubscribed. |
In order for the "Click" event to be tracked the link should be formatted in the following way:
https://www.leanplum.com/If the link is added with the following format it will not be recognized as a valid link and the "Click" event will not be tracked:
leanplum.com
Where to see your results
Campaign
Some of your overall campaign's metrics will be visible from the Campaign Table in the Command Center.
Analytics
The Analytics dashboard gives you access to all email metrics, and the ability to create your own metrics. Selecting one of the tiles updates the graph to show you the change over time.
The Analytics view is updated every two to four hours, so its user counts can lag behind the counts in Users and the Campaign Overview.

You can add your own custom metrics to track, or use filters and group by to really slice and dice.
Understanding the numbers
Sends and opens
It's possible for the number of Opens for your email campaign to be larger than Sends because Opens are not Unique Opens, and your users might open an email more than once.
The Unique Open Rate is not likely to provide meaningful results when viewing the numbers day-by-day because it's the number of unique users on that day divided by the number of emails sent on that day. Since your users may read your email several days after you send it, it's best to view the aggregate results of a campaign instead.
Sends and clicks
Similarly, it's possible to see more Clicks than Sends when looking at your numbers. You may have multiple links in your email (with each clicked link being tracked). It's entirely possible a user clicked multiple links, or the same link more than once.
Clicks without opens?
Opens aren't tallied unless all images and text are loaded, and because some email clients do not display images by default, it's possible for someone to click a link without fully "opening" your email because the client did not download the images.
Analyzing clicks in an email campaign
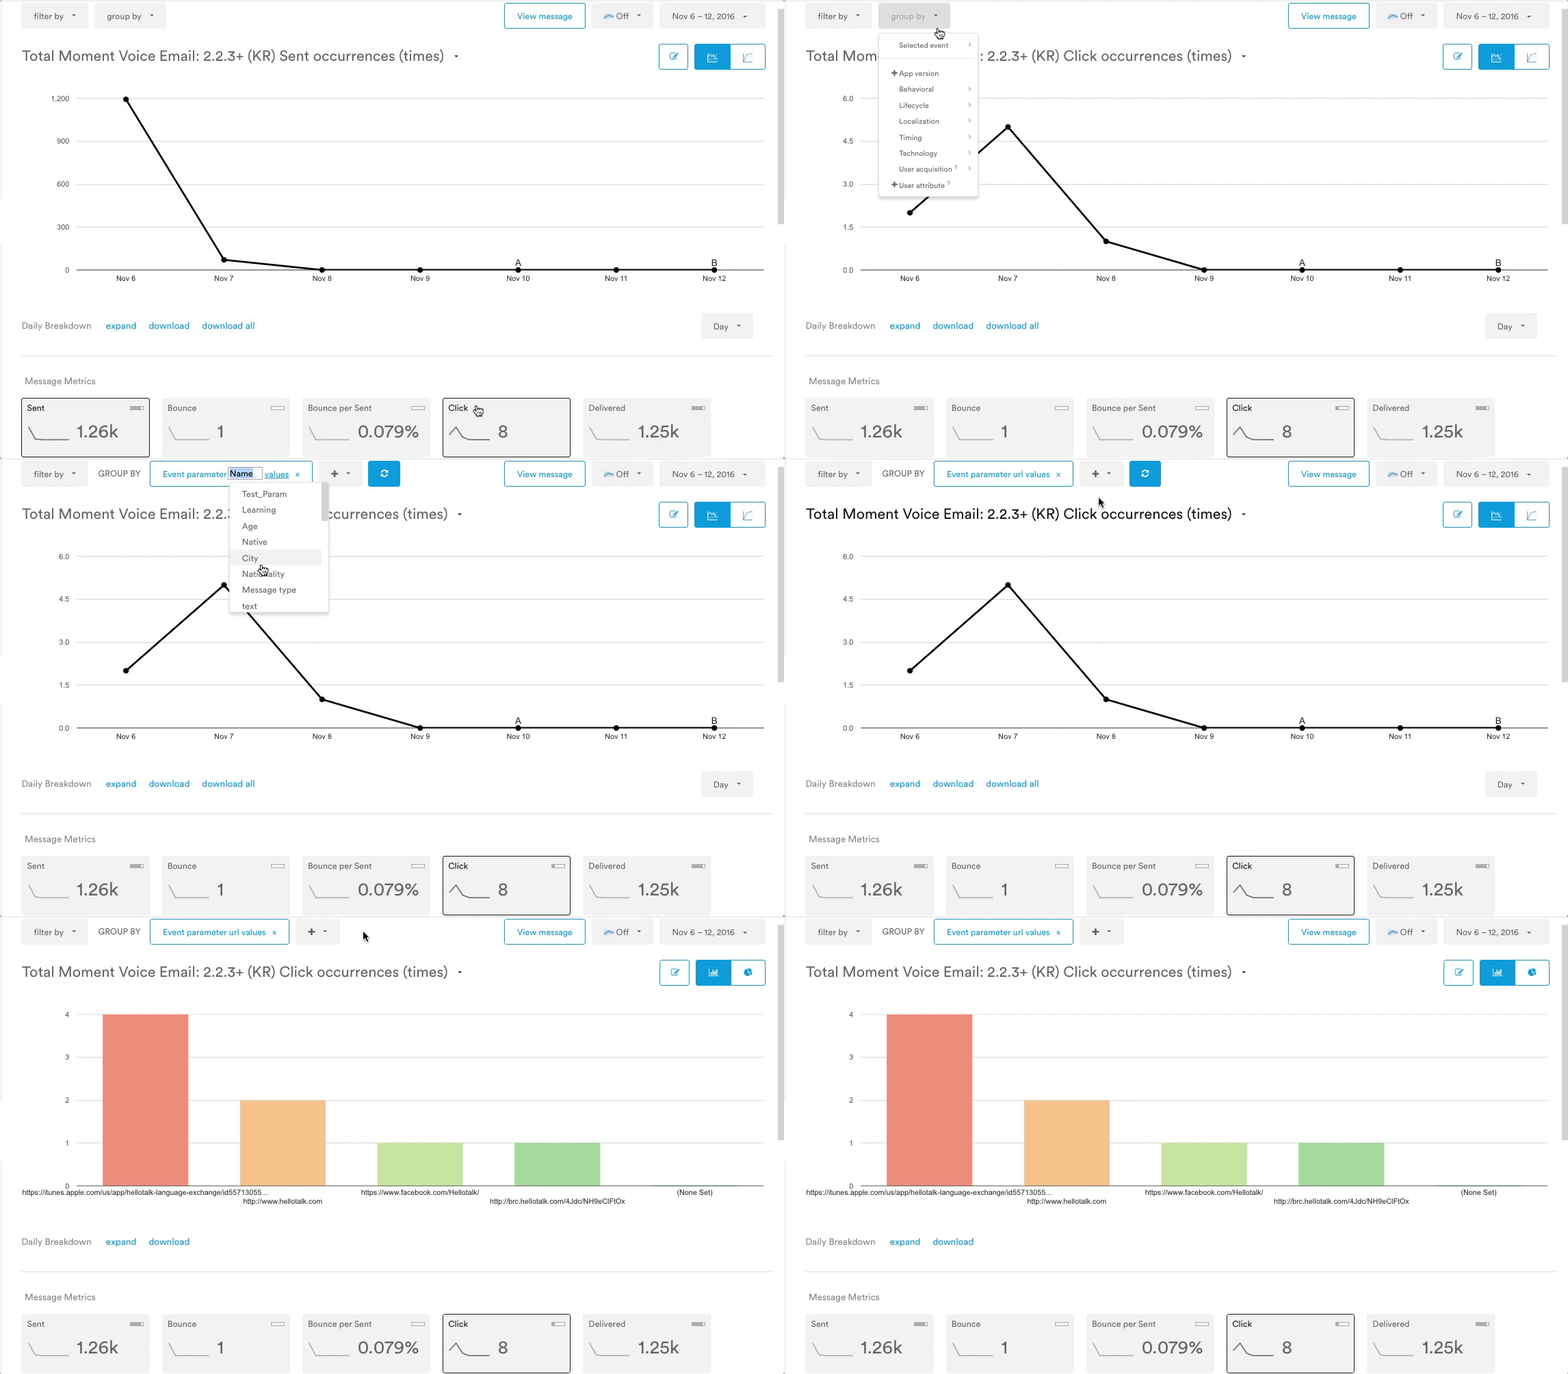
Leanplum automatically tracks a Click Event for every link in your email. In Analytics, you can do a "group by" report on the Click Event to see how many users clicked each one of your links.
Click Events are tagged with two event parameters:
index: The location of the link within the email. The first link will be 1, the second 2, etc.
url: The destination URL of the link.
So, you can group by either of these Event parameters to see how clicks compare.
- In the Analytics dashboard, select the email from the Messages section
- Select the Click metric tile below the graph
- At the top of the graph, open the Group by dropdown, and choose Selected Event > + Parameter
- Click Name
- Select the Click parameter (url or index) from the dropdown
- Click the Refresh icon

Updated over 2 years ago
