Event metrics
The metrics created for parameter metrics, message events, A/B test events, Campaign events, and your custom events
There are a couple of different ways to view metrics for a specific event.
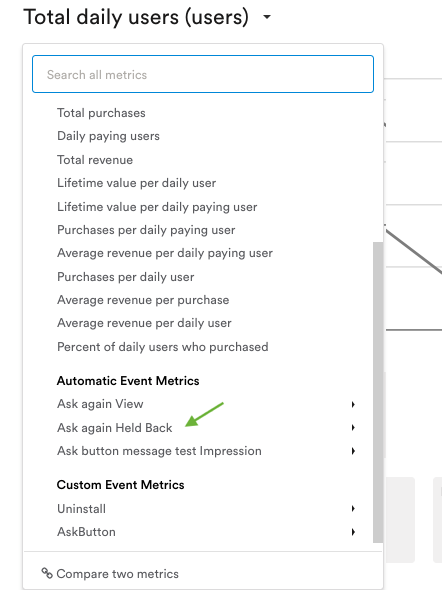
- Search for the event in the metric-selector dropdown. Once you choose your event, you can choose a specific metric to view on the main analytics chart.

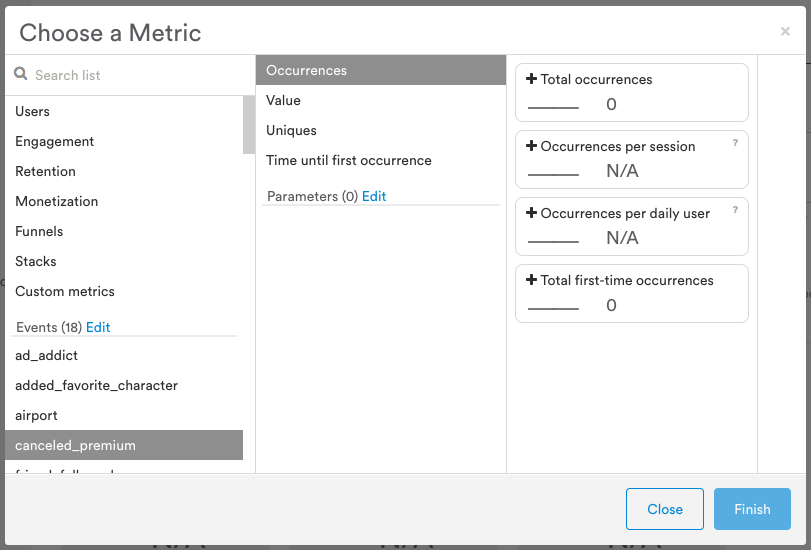
- Add a new metric tile then choose your event from the window that appears.

Available metrics
Message events, A/B test events, Lifecycle Campaign events, and your custom events are tracked with the following metrics.
Make sure the metric fits your use case
The following applies to A/B tests with no users in the Control Group (A.K.A. Holdback Group).
When testing a campaign or a variable that has an effect on user activity, don't use metrics that have (Total) Daily users as denominator. You should create a custom metric that has Total unique users as denominator instead, otherwise you will see misleading results. Learn how to build custom metrics here.
To learn more about the difference between Daily user metrics and Unique user metrics, read here.
Occurrences
| Metric | Definition |
|---|---|
| Total occurrences | The total number of times this event was triggered. |
| Occurrences per session | The average number of times this event is triggered per session. (Total # of X Event Occurrences) / (Total Sessions) |
| Occurrences per daily user | The average number of times a user triggers this event. (Total # of X Event Occurrences) / (Total Daily Users) |
| Total first-time occurrences | The total number of times this event was triggered for the first time. |
Value
| Metric | Definition |
|---|---|
| Total sum of event values | Total sum of all values associated with this event. |
| Average event value per occurrence | The average value of each occurrence of this event. (Total Sum of X Event Values) / (Total X Event Occurrences) |
| Value per session | The average value of this event per session. (Total Sum of X Event Values) / (Total Sessions) |
| Value per daily user | The average value of this event per user. (Total Sum of X Event Values) / (Total Daily Users) |
Uniques
| Metric | Definition |
|---|---|
| Total sessions that triggered event | Total sessions where this event occurs. |
| Total users who triggered event | Total number of users who triggered this event. Currently supported only per day. |
| Percent of sessions that triggered event | The percentage of sessions where this event occurs. 100 x (Total Sessions That Triggered X Event) / (Total Sessions) |
| Percent of users who triggered event | The percentage of daily users that trigger this event. 100 x (Total Users That Triggered X Event) / (Total Daily Users) |
Time until first occurrence
| Metric | Definition |
|---|---|
| Time until session first triggered event | The average time within a session until this event is triggered by a session action. (Total Time Until Session First Triggered X Event) / (Total Sessions That Triggered X Event) |
| Time until user first triggered event | The average time spent in the app (across multiple sessions) until this event is triggered by a user action. (Total Time Until User First Triggered X Event) / (Total First-Time Occurrences of X Event) |
Parameters
For events and states, Leanplum lets you track results for their numeric parameters. To view a metric based on a numeric parameter:
- Click on the + metric tile at the bottom of the Analytics Dashboard.
- Select any event from the left pane of the Choose a Metric window.
- Ensure the intended parameter is listed under Parameters in the middle pane. If the parameter is not listed, click Edit. In the new window, click the checkbox next to the intended parameter, then click Save.
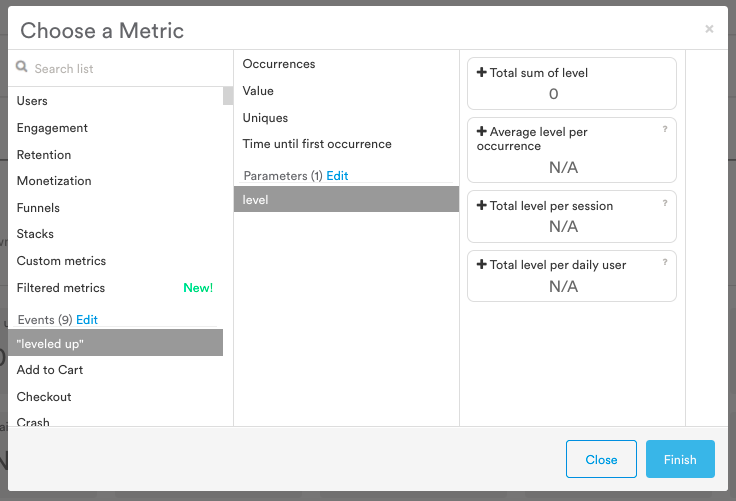
- Now, select the parameter in the middle pane. You should see the following metrics to choose from:
- Total sum of
- Average per occurrence
- Total per session
- Total per daily user
- Choose the metric you'd like to add.
- Click Finish.

Want to view analytics for string/text parameters?
To visualize your string parameters, you must first select the event that uses that parameter.
- Set a metric from the dropdown above the graph for the Event you'd like to analyze.
- Apply one of these options (Filter, Group by, Cohort) using the appropriate dropdown menu above the chart.
- In the dropdown menu, select Selected event > Parameter.
- If building a filter, enter the parameter value you'd like to view.
Parameter metrics
| Metric | Definition |
|---|---|
| Total sum of | The total sum of this event parameter. |
| Average per occurrence | The average count of this parameter per event occurrence. (Total Sum of X Event ) / (Total X Event Occurrences) |
| Total per session | The total count of this parameter per session. (Total Sum of X Event ) / (Total Sessions) |
| Total per daily user | The total count of this parameter per user. (Total Sum of X Event ) / (Total Daily Users) |
The metrics outlined above are all based on events tracked in Leanplum. Aside from the custom events that you set up with the Leanplum.track call, Leanplum automatically creates some events for different message types, A/B tests, and campaigns.
Events tracked by default
Leanplum offers a range of messaging channels, and each message type generates default events you can use as trigger events, Analytics filters, metric calculations, and more.
See our Leanplum Event glossary for details about the default events Leanplum tracks for messages, campaigns, and A/B tests.
Updated almost 3 years ago
